Content archived on 26 November 2024
ORR's 'GB rail industry financial information 2013-14' report provides a detailed analysis of the latest financial data from train operators, Network Rail and governments. The report highlights that there has been substantial investment and changes to the rail industry's finances over the past four years. During this time the rail industry has achieved high and sustained growth as passenger journeys have increased by 16.6% (260 million journeys) and the amount of freight carried on the network has risen by 18.1% (3.5bn net tonne kms). The industry has also invested significantly in network enhancements with £3bn spent in 2013-14, and further £12bn planned over the next four years.
The latest GB rail industry financial information report (1 April 2013 to 31 March 2014) shows that:
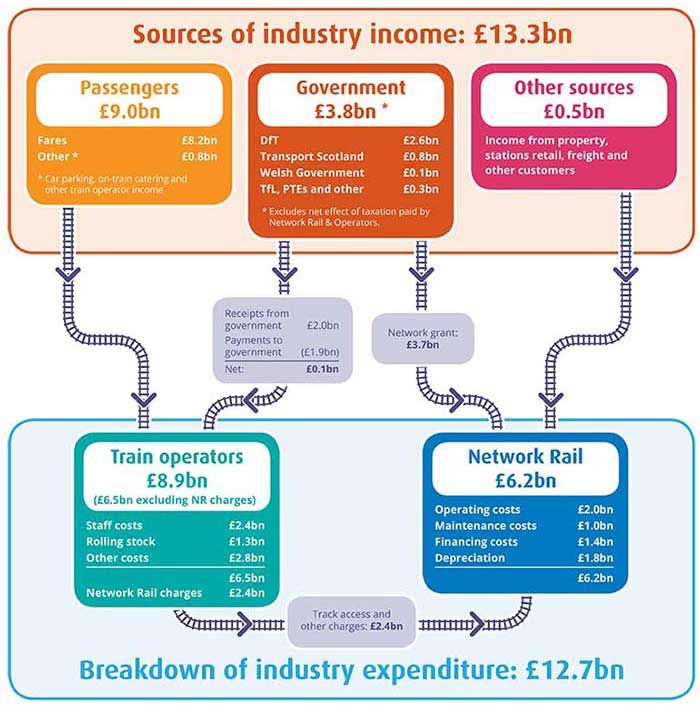
- The cost of running Britain's railways was £12.7bn, an increase of £0.15bn compared to 2012-13. The overall cost of running Britain's railways has remained stable, increasing by 0.03% over the past four years, growth despite significant growth in use of the railways (17.2% passenger growth and 18.1% freight). The network also experienced substantial investment over this period – including enhancements such as Thameslink, major improvements at Reading Station and the Edinburgh-Glasgow Improvement Plan.
- Rail industry income from passenger fares has increased significantly by 10.8% to £8.2bn since 2010-11, consistent with the increase in passenger journeys. Passengers have contributed an increasing proportion of the rail industry's income relative to taxpayers over the past four years – up from 55.6% in 2010-11 to 61.5% in 2013-14.
- Governments continue to make significant financial commitments to the railways, contributing £3.8bn in the past year. Total government funding varied from £1.88 per passenger journey in England, to £7.77 per journey in Scotland, and £9.18 per journey in Wales.
ORR chief executive, Richard Price, said:
There has been substantial growth in the use of the railways in the past four years. Passengers are increasingly the main funder of the railways, and must be central to developing plans for future services and investment. ORR's report also highlights that the rail industry has been successful in keeping costs stable despite carrying significantly more passengers. Our industry financials publications provide an open and comprehensive explanation of industry income and expenditure to help passengers understand how the money they pay in fares is being used.
Sources of income

Notes to editors
- Follow the Office of Rail Regulation on Twitter @railregulation for the latest announcements and rail data.
- Download the complete 'GB rail industry financials information 2013-2014' report here: https://orr.gov.uk/__data/assets/pdf_file/0005/16997/gb-rail-industry-financials-2013-14.pdf
- All figures adjusted for inflation.
- The cost of running Britain's railways was £12.7bn in 2013-14 – an increase of 0.7% on 2012-13. Half of these costs were incurred in train operations and half were incurred in managing the rail infrastructure.
- Total government funding was £3.8bn in 2013-14, representing 28.5% of the industry's total income. Government funding decreased 8.1% from 2012-13, 12.0% compared to 2011-12, and 16.4% when compared to 2010-11.
- We have made some changes to the way in which we analyse and allocate Network Rail's infrastructure costs between different geographies in this year's publication. We have restated our previously published industry analysis on a consistent basis and this is available on our website. We recognise that different approaches could be used to allocate infrastructure costs which would give a different interpretation of, for example, where government is providing financial support. For this reason we suggest care should be taken in interpreting those parts of our analysis that examine costs, income and government support at a sub-GB level.
- There are significant variances in train operating costs between franchises. There will be many reasons for these variances such as nature of the franchise and costs which are only partially controllable by train operators, for example, rolling stock leasing costs where train operators have only limited choice about what trains they can operate.
- There are significant variances in franchise specifications, population, and size of the network and associated subsidies. This report does not seek to investigate or explain the reasons for these differences.

