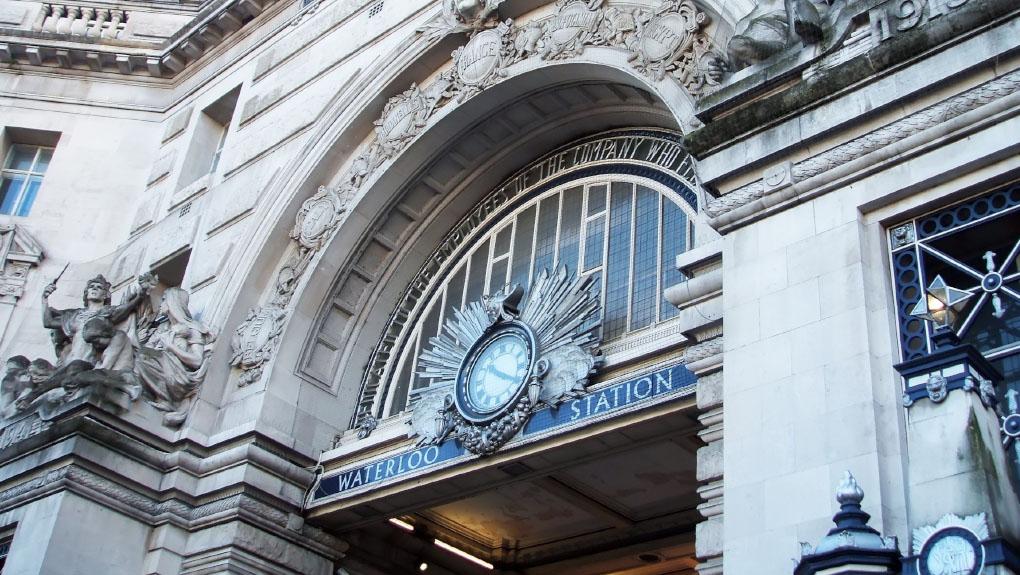
The numbers are revealed in the Office of Rail and Road’s (ORR) estimates of station usage statistics for the year April 2021 to March 2022, which include the annual total of passenger entries and exits at each of the 2,570 stations in Britain.
After a 16-year reign, London Waterloo was knocked off the top by Stratford (London) last year (April 2020 to March 2021), but it finds itself back in pole position following 41.4 million passenger entries and exits in the latest year (April 2021 and March 2022). However, that total is some way short of the estimate of 86.9 million from two years ago.
London Victoria retained its position as the second most used station with 36.8 million entries and exits, while London Bridge stayed in third spot with 33.3 million. Stratford (London) dropped down to fifth with 28.2 million, although that is more than double last year’s estimate.
There are eight stations that serve the capital in the top 10, and are joined by Birmingham New Street which remained in eighth place (22.7 million) and Manchester Piccadilly, which moved up from last year’s 18th to this year’s 10th (19.6 million).
The top ten:
- London Waterloo 41,426,042
- London Victoria 36,776,338
- London Bridge 33,309,348
- London Liverpool Street 32,165,310
- Stratford (London) 28,182,238
- London Paddington 23,870,510
- London Euston 23,097,606
- Birmingham New Street 22,682,526
- London Kings Cross 20,476,492
- Manchester Piccadilly 19,581,442
Highbury and Islington, Clapham Junction, Barking, and East Croydon, located outside London Fare Zone 1, dropped out of the top 10.
In the latest year, there were 24 stations in Great Britain with more than 10 million entries and exits. This is compared to just five stations the previous year and 43 stations two years ago.
In Scotland, Glasgow Central remained the most used station with 15.3 million entries and exits, up from 5.3 million last year, but down from 32.5 million two years ago.
Edinburgh was the second most used station with 13.6 million entries and exits and Glasgow Queen Street was the third most used station (8.5 million).
Across Wales, Cardiff Central remained the busiest station in the latest year with 7.5 million entries and exits, up from 2 million last year, but down from 12.7 million two years ago.
Newport was second (1.8 million) and Swansea moved up from fourth to third, with 1.5 million.
Elton and Orston in Nottinghamshire was the least used open station in the latest year, with 40 recorded entries and exits. It had the second lowest usage two years ago (April 2019 to March 2020) when it had 68 entries and exits.
There were six open stations with fewer than 100 entries and exits in the latest year:
- Elton and Orston, Nottinghamshire (40 entries and exits)
- Teesside Airport, Darlington (42)
- Stanlow and Thornton, Cheshire (44)
- Denton, Greater Manchester (50)
- *Kirton Lindsey, North Lincolnshire (68)
- Sugar Loaf, Powys (76)
*The weekly service from Kirton Lindsey was suspended between 1 April to 22 May 2021 and again from 1 January 2022 to 31 March 2022.
Feras Alshaker, Director of Planning and Performance at the Office of Rail and Road said:
Notes to editors
- ORR’s estimates of station usage April 2021 to March 22
- Estimates of station usage FAQs
- Latest station usage data tables and interactive dashboard
- Estimates of station usage are derived from LENNON, the rail industry’s ticketing and revenue system, together with some local ticketing data. A number of adjustments are made to the source data to make the estimates as accurate as possible
- The Office of Rail and Road is the primary producer of official statistics for rail

