We hold National Highways to account for its performance across a range of government set performance indicators that reflect the priorities of Strategic Road Network users and other stakeholders.
To support this, we’ve developed an interactive Highways performance dashboard, allowing users to explore different performance themes and track changes over time.
The performance indicators are set by government for each Road Investment Strategy (RIS) and for RIS2 (which runs from 2020 to 2025) are organised around themes including:
- improving safety for all
- fast and reliable journeys
- a well maintained and resilient network
- being environmentally responsible, and
- meeting the needs of all users
National Highways is responsible for achieving national-level targets for each of its Key Performance Indicators (KPIs) and we report on its performance in our Annual Assessment.
Regional variations in detail
While targets are set nationally, we also analyse performance differences across National Highways' six operating regions.
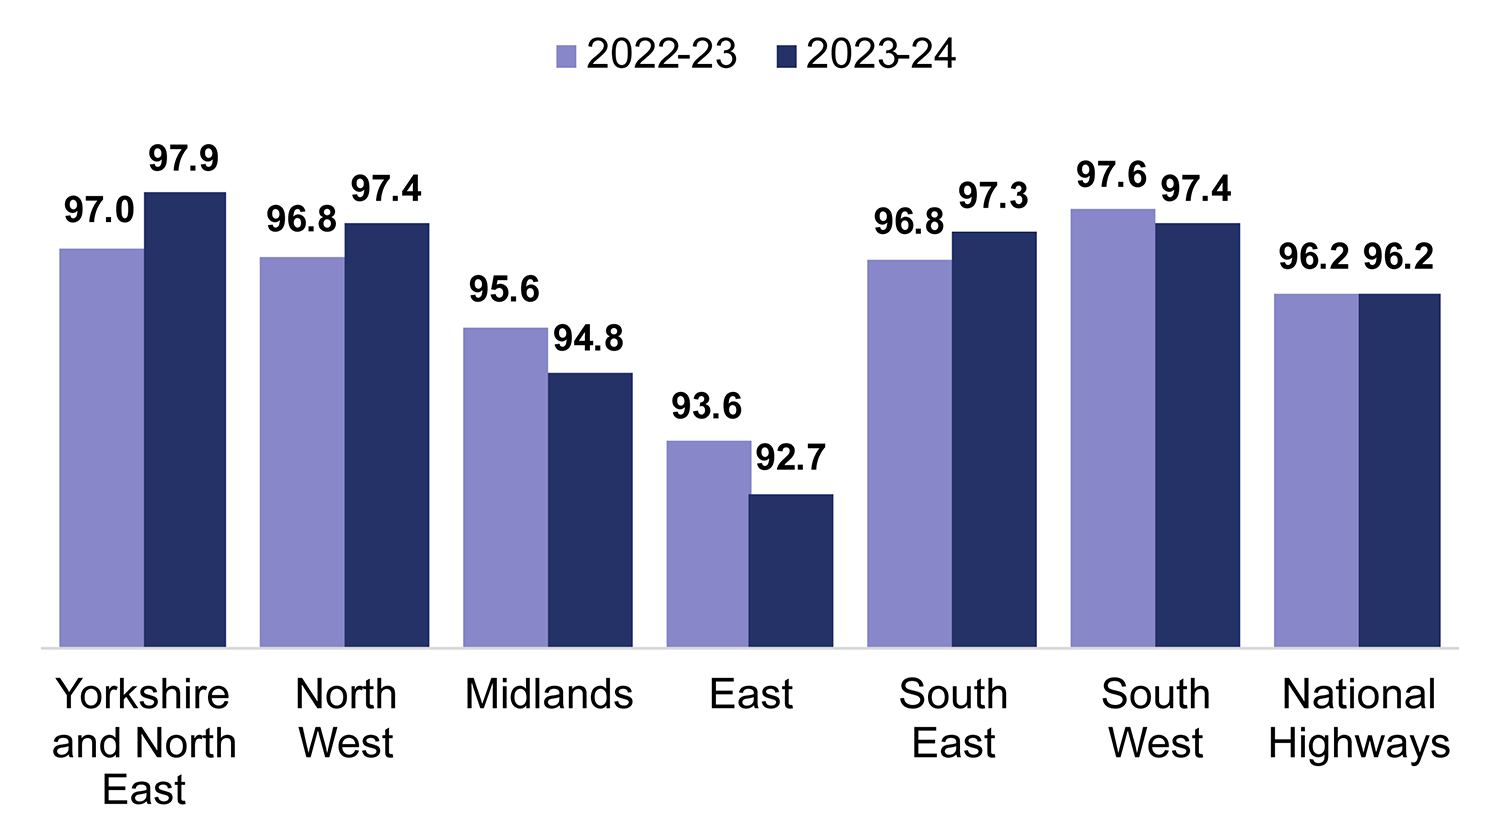
In 2023-24 for example, we noted a widening gap in road surface condition KPI performance between the best- and worst-performing regions. Nationally, over 96% of road surfaces meet the 'good condition' KPI target. However, the East of England lags behind at less than 93%. Put differently, almost double the proportion of roads in the East fail to meet the condition benchmark.
Our Pavement Condition benchmarking report notes that a higher prevalence of difficult to maintain concrete roads in the East partly accounts for this discrepancy, though it does not fully explain the difference. As part of its overall approach to road maintenance, we expect National Highways to take further action to improve pavement condition in the East.
Figure 1: Pavement condition KPI, percentage of the pavement asset in good condition, England’s strategic road network, April 2022 to March 2023 compared to April 2023 to March 2024

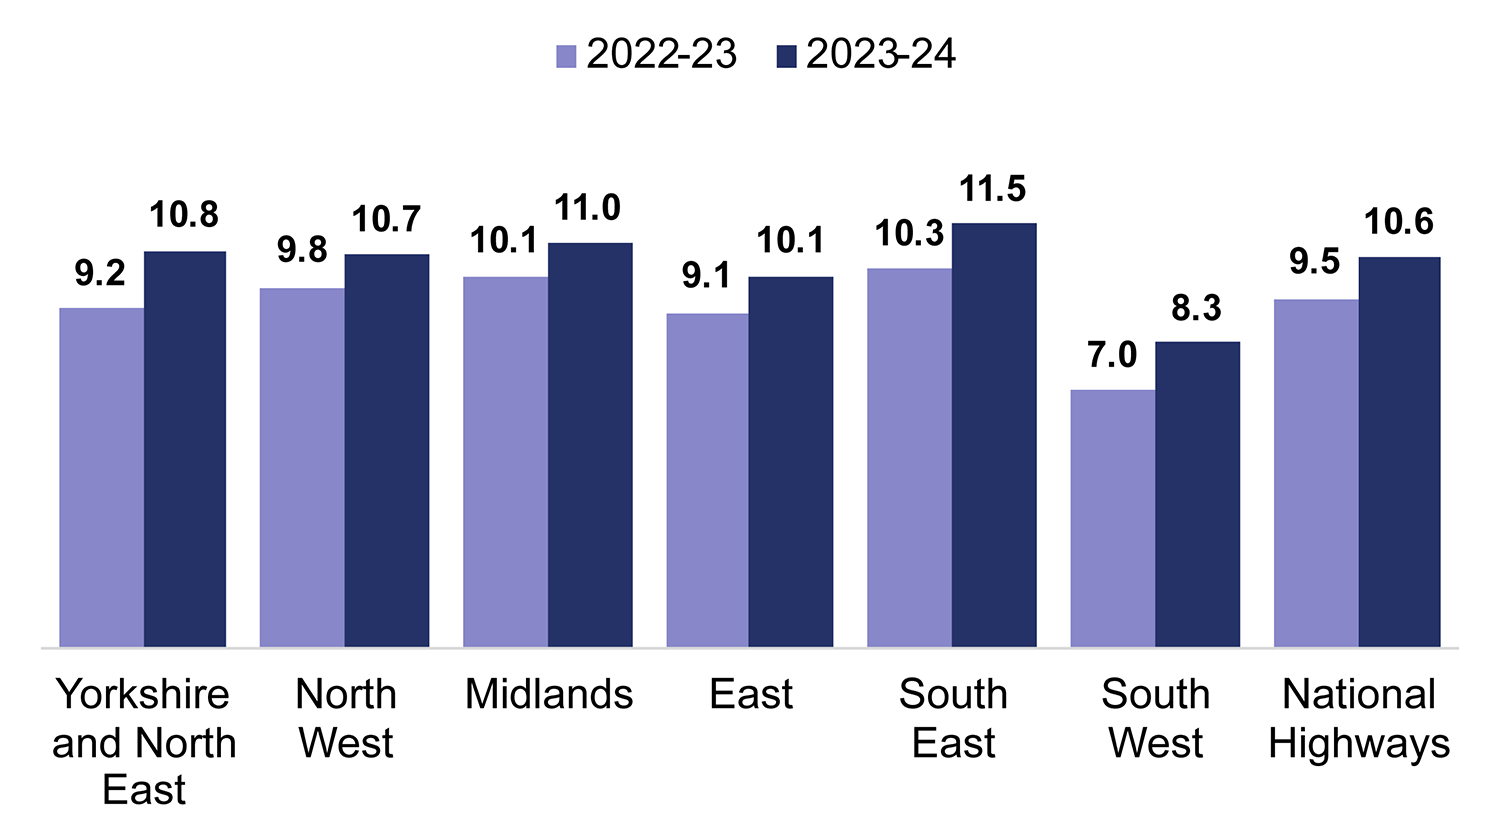
Looking at National Highways' average delay KPI, we can see that delays have increased in every region of England, with the South East having the most average delay (measured in seconds per mile) while the South West has the least.
Increased levels of traffic is the major factor with 2.3% more miles travelled on the strategic road network in 2023 than 2022.
Figure 2: Average delay KPI, measured in seconds per vehicle mile, England’s strategic road network, April 2022 to March 2023 compared to April 2023 to March 2024

The aim of these dashboards is to bring greater transparency to the regional variations across England’s strategic road network and informing our continual work to hold National Highways to account. The full range of performance indicators can be explored on our dashboard. You can also read a region by region overview.


